
By Lesley Greenwood [E.2.7a.3b.9c.1d]. Originally published in HAFS Journal Vol 16 No 2, Nov 2021. For Part 2 see HAFS Journal Vol 16 No 3, May 2022.
Introduction
The Hungerford & Associated Families Society (HAFS) has, over the past three decades, accumulated a massive amount of information, providing a comprehensive family history and an extensive Hungerford family tree.
It is timely, in this Australian census year 2021, to therefore look at some demographic data pertaining to our Hungerford family. Information compiled in the HAFS’ Hungerfords Down Under (HDU) database up to September last year (2020) is analysed to provide a history of births, fertility rates and family size over eight generations of the E line of Hungerfords since arriving in Australia in 1828. Generational trends are then compared to the Australia-wide situation and some comments made on anticipated future trends for the Hungerford family.
Methodology
The HDU coding system (that assigns a unique alphanumeric code to every Hungerford descendant based on their family lineage) and index spreadsheet were used to sort and filter various data according to each individual’s generation, code, gender and year of birth. Using those parameters in various combinations, it is possible to glean some demographic characteristics of the Hungerford family in Australia. It is acknowledged that record details are incomplete for some branches and for some individuals, however these are considered to be negligible and do not compromise the general statistical findings of this research, unless where noted that caution be applied.
There are over 8,250 individuals recorded in HDU in the E line, that is, descendants of Catherine and Emanuel Hungerford and the partners of those descendants. The numbers of births in each generation are a count of direct family descendants according to their Hungerford code and can be seen in Table 1, column 3 (see below).
Total fertility rate is the average number of children born to the number of females of reproductive age (generally aged between 15-49 years) in the previous generation. The data were sorted by Hungerford generation and by gender to calculate (i) the numbers of direct descendants in each generation and (ii) the number of females of child-bearing age in the previous generation, to calculate fertility rates over eight generations of the Hungerford family. Data were also sorted to illustrate the effect of fertility on family size. The assumptions underlying this analysis are provided at the end of the article.
Catherine and Emanuel Hungerford arrived in Australia in 1828 with their, then, eight children. Catherine gave birth to two more babies, born in West Maitland NSW, to complete this first generation of the founding family. The NSW fertility rate in the 1830s was around 6.5 children per woman so Catherine, with ten children, contributed more than the average at that time. This first generation of ten children (coded E.1 to E.10) and their eleven spouses subsequently produced 75 children, that is, grandchildren of Catherine and Emanuel. This HAFS-coded ‘a’ (second) generation was born between 1839 and 1892.
Results
Table 1 below illustrates the increasing numbers of Catherine and Emanuel’s direct descendants with each successive generation (refer to column 3). The number of Hungerford offspring is the count of biological children in each generation. The date range of births refers to the period of time between the first birth and the last birth in each Hungerford generation. The table also summarises the outcome of the fertility data analysis. The number of females of fertile age refers to the biologically-descended and spousal Hungerford females who attained reproductive age. Note that females who died young were not counted in the number of reproductive-age females.
The results indicate that the largest cohort of Hungerfords to date is the sixth, that is, the HAFS-coded ‘e’ generation of Hungerfords (4 x great-grandchildren of Catherine and Emanuel), the first of whom was born in 1931 and the total of which currently numbers 1,926 people. This generation is still growing, as there are members in the previous ‘d’ generation that are yet to be or are still in family formation age groups. The youngest known member of the ‘d’ generation was born in 2011. The ‘d’ generation commenced in 1910 and is, to date, the most widespread chronologically, spreading across 101 years and numbering 1,225 people. Based on current information, the ‘e’ generation is likely to exceed the ‘d’ timespan – one could assume it may extend into the mid-21st Century, thus span around 120 (+ or -) years between the oldest and eventual youngest of its cohort.
Table 1 – Fertility rates for successive generations of Hungerfords*
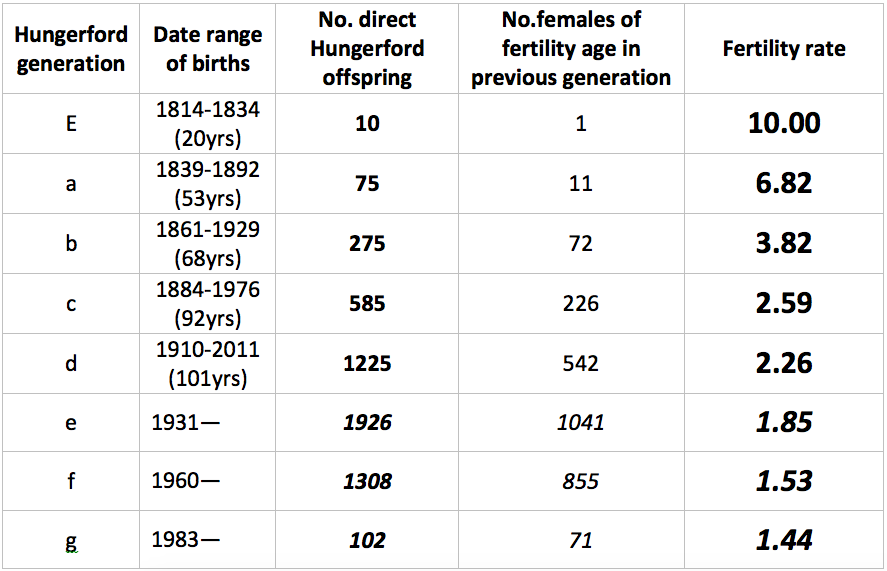
* Refer to the assumptions at the end of the article. Note that ‘e’, ‘f’ and ‘g’ are uncompleted generations and so the fertility rate for them will be subject to change. There may also be missing data yet to be updated.
From the table above, and including the one family member who is in the next ‘h’ generation, there are more than 5,500 known direct descendants of Catherine and Emanuel Hungerford, born in the 207 years since Catherine gave birth to their first child. There are 74 sets of twins included in this total, representing 2.69% of descendants. The large sizes of the earlier ‘E’ and ‘a’ generations (10 children and 75 grandchildren respectively) provided high initial multipliers thus resulting in the high number of total descendants today across eight generations – ‘E’ to ‘g’ – of Hungerfords. The majority is Australian-born but the E line of the Hungerford family is more ethnically diverse and now has members who are located around the globe.
The results for total fertility rates for the Hungerford family show that they have declined over the last 200+ years, from a high of 10 children for the founding female Catherine to 2.26 children per reproductive-age female for the ‘d’ generation (the last complete generation) to 1.53 children for those of the ‘f’ generation who are beyond reproductive age and 1.44 children per female for those of the current ‘g’ generation who appear to have completed childbearing. The rates for the last three generations will be subject to change over time until the last of the female cohort in each of the generations has progressed past reproductive age; the rates may be more or less than currently calculated, depending on the ultimate future numbers of fertile age females in each previous generation and the numbers of offspring they produce.
The results for the Hungerford family can be compared to the change in fertility rates in Australia from 1800 to 2020 (illustrated in Graph 1 below). The general trend in Hungerford family fertility rates would appear to be reasonably consistent with the national trend—that of gradual decline—in Australia.
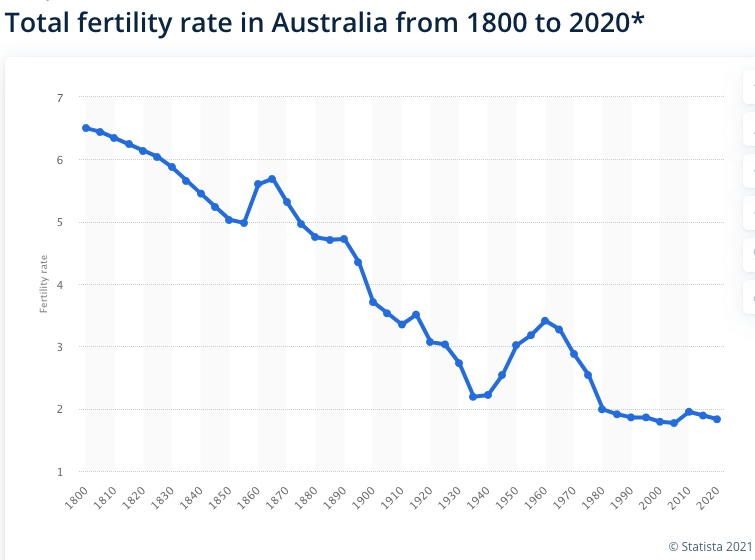
Source: Statista 2021, showing Australian total fertility rate trend 1800-2020
Changes in fertility rates in Australia in the 19th and 20th centuries were influenced by social and economic events, generally trending lower as living standards and educational opportunities improved. However, as evident in the graph, there were distinct periods where the trend was affected by major events, particularly the 1860s gold rush (resulting in a high migrant influx and more births), the Depression of the 1930s (resulting in a lower number of births), the global baby boom (1945-1964) that followed the end of World War II and the introduction of the contraceptive pill in Australia in 1961 (lowering the rate of reproduction). The overall, long-term trend has been a continued decline in fertility rates over time.
The Hungerford family data set was further interrogated to ascertain whether these national patterns were mirrored in the Hungerford family. The numbers of children of Hungerford-descended women born in the 1920s and 1930s were compared against the numbers of children of women born in the 1900 and 1910 decades and in the decades of the 1940s to 1970s. Hungerford women born in the 20 years 1920-1939, that is the majority of those in childbearing ages after WWII, exhibited a rate of 2.37 children each, compared to 2.13 children in the previous 20-year period 1900-1919 and compared to the two sets of double decades (1940-1959 and 1960-1979) after the baby boom years, where the rates dropped to 1.98 and 1.52 children respectively. These figures suggest that there was (i) a slight increase in Hungerford births during the post-war baby boom but not as significant as in the general Australian population; and (ii) a later decline in childbirths since the ready availability of contraception.
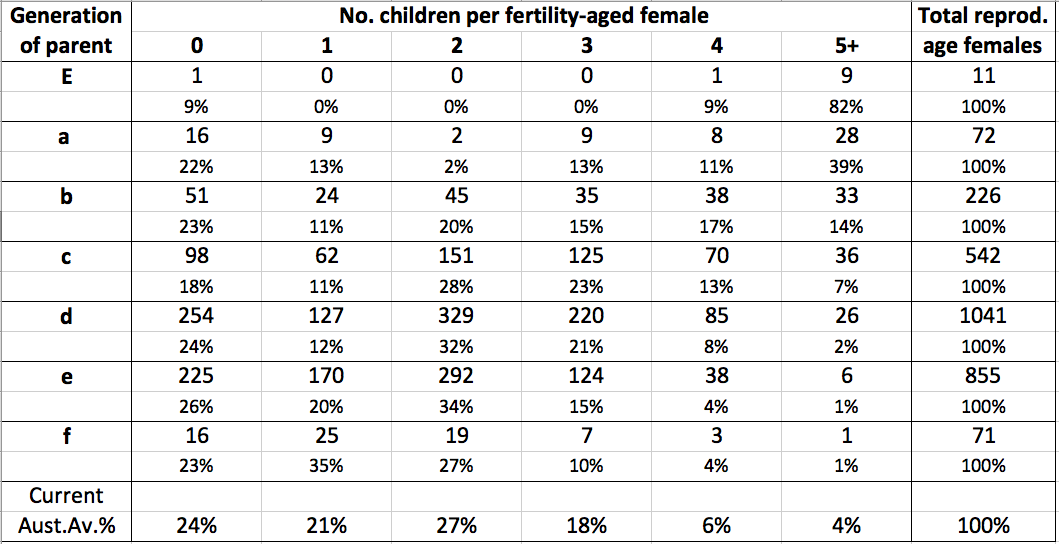
Whereas fertility rates provide some indication of average family size, the counts of numbers of children per reproductive-aged woman provide an indication of the spread of family sizes. The pattern emerging in the fertility rates and family sizes of the current ‘f’ generation (which commenced in 1960) is generally following anticipated national patterns, that is, mostly limiting progeny to no more than two children (see Table 2. below). Bear in mind that the tail end of this ‘f’ generation is still in the family formation stage and figures should be considered as indicative only for this group.
Changes in family size over time, as measured by the number of children born to each fertility-aged female, are summarised in Table 2 below. The first (‘E’) generation of Catherine and Emanuel Hungerford’s ten children and their eleven spouses contained eleven reproductive-age females. Nine of these women (82%) had five or more children each (including three mothers who had more than ten children each). Note that the analysis does not provide data on blended families, for example, such as that of the largest single family of Hungerfords, namely E.6, with 17 children, which was the combined total of offspring from two wives. There are numerous other instances among the Hungerfords of families where there have been, and are currently (but not simultaneously), more than one conjugal union.
That Australian women are having fewer children is also exhibited in the successive generations of Hungerfords. Large families of five or more children were the predominant sizes of the ‘E’ and ‘a’ generations (82% and 39% respectively) whereas the current ‘f’ generation has shifted the emphasis, with 85% of families having two or fewer children.
Table 2 – Hungerford families by generation and family size
The age at which Australian women are having their first child is increasingly in their later ages, with the norm now around the 30-34 years age range. A sample study of over 520 Hungerford women, for which there is date of birth data of both mother and child available, indicates that this trend is apparent in the Hungerford generation too. Of mothers born in the early 1820s to 1850s, the average age at the birth of their first child was below 24 years of age. Over the succeeding decades, it has crept up gradually, to over 26 years old in the 1950s and at the end of last century it was over 28 years of age. This tendency for women to delay having children is generally consistent with them also having fewer children.
Comments
The fertility rate at which a population replicates itself is around 2.1 children per reproductive-age female (to replace herself and her partner and to account for early mortalities in the general population and skewed sex ratios at birth). Total population growth in Australia is achieved through a combination of natural growth and a reliance on immigration, the latter of which currently contributes around 60%. Numbers of births in Australia have plateaued in the 21st Century; in 2019 the rate was 1.66 children per woman. The reproductive rate of future generations of Hungerfords is likely to mirror the Australian national trend, that is, remain at low levels as is evident in the information exhibited in Tables 1 and 2 and in Graph 1.
Factors, largely social and economic, impinging on delayed parenthood include female education and higher workforce participation, delaying major life-changing transitions, such as moving out of the family home and partnering, cost of living expenses, especially housing, and choosing to have smaller families. Such decisions are possible through the availability of birth control measures and the ability of young people to pursue and prioritise their personal aspirations. The delay in first births also contributes to the decline in total fertility rates to the low levels exhibited today.
The Hungerfords, like the Australian population in general, have not achieved replication rate for several decades. In terms of anticipated future generations, the ‘e’ generation, currently numbering 1,926 direct descendants, is the largest generational cohort in the Hungerford family to date, being the children of the, so far, 1,041 reproductive-age ‘d’ generation females. It will be further supplemented by the future offspring from the remaining ‘d’ generation younger females approaching their fertile years.
Assuming, ceteris paribus, that is that current global conditions (social, political, economic, epidemiological, climatic etc) remain relatively constant for the foreseeable future, the total number of Hungerford descendants will continue to grow but at a lesser rate than in earlier generations given the trend of low and declining fertility rates. The ‘e’ generation may grow to more than 2,000 in number by mid-century and subsequent generations may exceed this magnitude. The Hungerford lineage is here for the duration.
Assumptions and explanations
The HAFS coding system applies an alphanumeric code to each individual according to their numerical birth order in the family; their generation is indicated alphabetically. The code is added to with each new generation to signify family lineage. For example, E.2.7a.3b.9c.1d is a ‘d’ generation descendant, i.e. 3 x great-grandchild of Emanuel and Catherine Hungerford, being the first child (1) of the ninth child of the previous generation (9c), whose parent was, in turn, the third child (3b) of the seventh child (7a) of the second child (2) of Emanuel and Catherine Hungerford. Spouses are assigned the same code as their partner, with the addition of ‘=’ after the code.
The nature of HDU records is such that, in only a few cases, some subjectivity and value judgements had to be applied where information is incomplete (for example, where birth year was not given or where gender was not able to be discerned). Each individual with a Hungerford code was counted once; this meant dismissing the second record of individuals who have two codes (from being related to two different branches of the family) to ensure they weren’t double-counted. Children were assigned to the birth mother where there were interfamily marriages, for example, ‘Madge’ was the wife of E.9.7a then E.9.8a and she had a combined total of five children; and the descendants of Emma Hungerford (E.6.5a), who is recorded in HDU in the H line, are included and ascribed to her. The case study counts adopted children as direct Hungerford descendants (as they receive a Hungerford code) but not step-children of non-bloodline partners, unless they appear to have been adopted. Fertility-aged females included those who had no children and those few females who had given birth to at least one child but died early in their reproductive years. In a few cases, the number of offspring was limited as the husband died early.
The E generation of the Hungerfords (the children of Catherine and Emanuel) comprised eight male and two female descendants. One of the males did not marry and two of the men married twice, resulting in eleven females in that first generation, one of whom had nil offspring. In table 1, subsequent generations show that the number of reproductive-age females in column 4 is different to the figures in the previous row in column 3 but are of similar magnitude. Hypothetically, if each generation was split evenly between genders and all married once, these two numbers would be identical. In reality, the differences are accounted for by early deaths, multiple marriages in some cases (both on the part of women and men), males with nil offspring and higher numbers of males.
Note that the later ‘e’, ‘f’ and ‘g’ generations are not complete, as there are still individuals and families in these generations that are approaching or are still in reproductive ages; only females over 40yo and some younger women who have given birth in these generations and their offspring were used to calculate fertility rates for these generations. The data suggest that almost all families in these so-characterised groups may have completed their family formation (at least five years since last birth). The statistics for these generations may not be reflective of the patterns for later members in that group and so should be viewed more cautiously.
The data used to ascertain the spike in post-WW2 babies used only direct descendant Hungerford females, as HDU records generally do not have data on birthdates of Hungerford spouses. It is assumed that this sample is representative of the whole Hungerford family. Likewise, the sample data on age of the mother at first birth is also assumed to be indicative of the whole family.
References:
Australian Bureau of Statistics (ABS), Births, Australia. (Catalogue No. 3301.0) Various years, especially 2001 and 2019. (see abs.gov.au/statistics/people/population/births-australia/latest-release)
Hugo, G, Australia’s Changing Population, Oxford University Press, Melbourne 1986.
Hungerford & Associated Families Society Inc, Hungerfords Down Under. Database maintained by HAFS, 2020 update (unpublished).
Kelly, R, Preliminary Fertility Rate Projections for 2021. NSW Intergenerational Report, Treasury Technical Research Paper Series, 2021.
Paice, J, Fertility: a Baby Bounce for Australia”. Current Issues Brief No 1 2003-04 (see aph.gov.au)
www.statista.com/statistics/fertilityrateAustralia1800-2020
Related Articles
-

HAFS has, over the past three decades, accumulated a massive amount of information, providing a comprehensive family history and an extensive Hungerford family tree. It…